Spectroscopy for the MCAT: Everything You Need to Know
/Learn key MCAT concepts about IR and NMR spectroscopy, plus practice questions and answers
(Note: This guide is part of our MCAT Organic Chemistry series.)
Table of Contents
Part 1: Introduction to IR and NMR spectroscopy
Part 2: IR spectroscopy
a) Experimental procedure
b) Key functional groups
c) Example
d) Related forms of spectroscopy
Part 3: NMR spectroscopy
a) Experimental procedure
b) Reading a spectrum
c) Splitting and coupling
d) Example
Part 4: High-yield terms
Part 5: Passage-based questions and answers
Part 6: Standalone questions and answers
-----
Part 1: Introduction to IR and NMR spectroscopy
Since molecules are so small, how do chemists determine the structure of an unknown molecule? If researchers cannot observe single molecules with the naked eye, how do we verify the identities of chemical products and reactants?
The answer lies in spectroscopy and other experimental techniques. In this guide, we'll cover everything you need to know about two of the most important forms of spectroscopy: infrared (IR) and nuclear magnetic resonance (NMR) spectroscopy. From the fundamental experimental principles to how to interpret the resulting data, by the end of this guide, you'll be equipped for anything the MCAT has in store for you come test day.
Note that while you may have learned about IR and NMR spectroscopy in your undergraduate courses, the level of depth required to do well on these topics for the MCAT is significantly lower. For example, you may have been asked to draw a molecule that generated a certain spectrum in an undergraduate organic chemistry lab course. The MCAT will not require this free recall and production of information—after all, the MCAT is a multiple-choice exam.
With that all out of the way, let’s begin!
-----
Part 2: IR spectroscopy
a) Experimental procedure
Infrared spectroscopy, or IR spectroscopy, involves the casting of infrared light through a molecular sample. The energy from the light then causes covalent bonds within the molecule to vibrate. These bonds can vibrate by stretching and bending.
As the light passes through the sample, a spectrometer measures the percentage of light that passes through the other end. This percentage is expressed as the percent transmittance of light over a range of frequencies. The frequencies at which the light is absorbed depend on the types of functional groups present in the sample. Thus, IR spectroscopy can identify specific functional groups and types of bonds in a compound.
One way to visualize the vibrations of the covalent bonds is by using the spring model. Imagine two balls connected by a spring. When the tension of the spring is increased, the frequency of its vibration will increase. Additionally, when the strength of the bond is increased, the frequency at which it vibrates will increase. Lastly, if the mass of the two balls is increased, the frequency will decrease.
These are the same principles behind tuning a guitar: the tighter a string is tuned, the higher its pitch will be. When the strength of a guitar string is increased, a thick string is used instead of a thin string, the frequency also changes. Thicker strings, like those you’ll find on a bass guitar, produce lower frequencies than the thinner strings you’ll find on a regular guitar.
Figure: Stretching and bending of covalent bonds between atoms, as visualized by the spring model.
These intramolecular vibrations and rotations are elicited and detected with IR spectroscopy.
b) Key functional groups
The plot of an IR spectrum has percent transmittance on the y-axis and the wavenumber on the x-axis.
The fingerprint region is a special range of wavenumbers from around 1500 to 500 cm-1 that is unique to a certain compound. For the MCAT, you'll be working within a different range, from around 4000 to 400 cm-1. The table below lists the key functional groups for which you should memorize their characteristic wavenumbers. These, in particular, are important because they are characteristic of biological compounds.
| Functional Group | Wavenumber |
|---|---|
For more information on the way they behave in reactions, be sure to refer to our guide on important functional groups.
c) Example
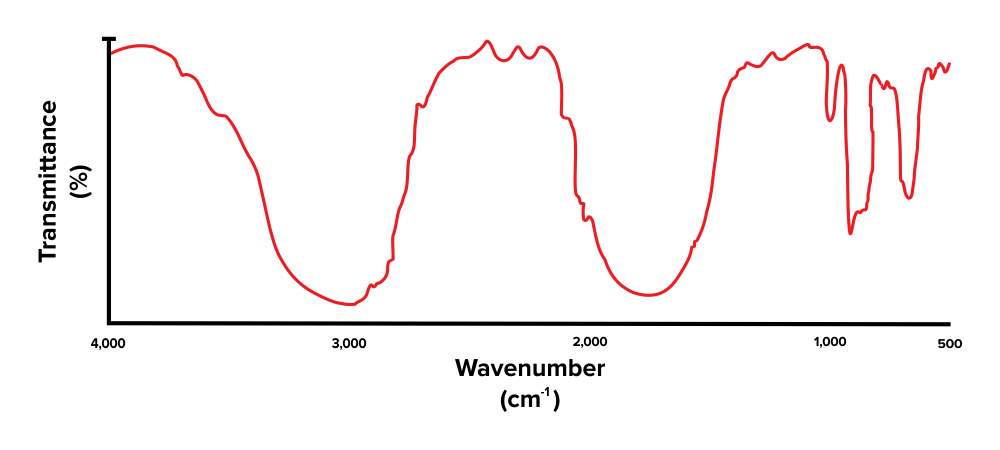
Let’s take what has been discussed so far and apply it using an example problem. Try to identify the functional groups present in the IR spectrum below.
Figure: An unlabelled IR spectrum.
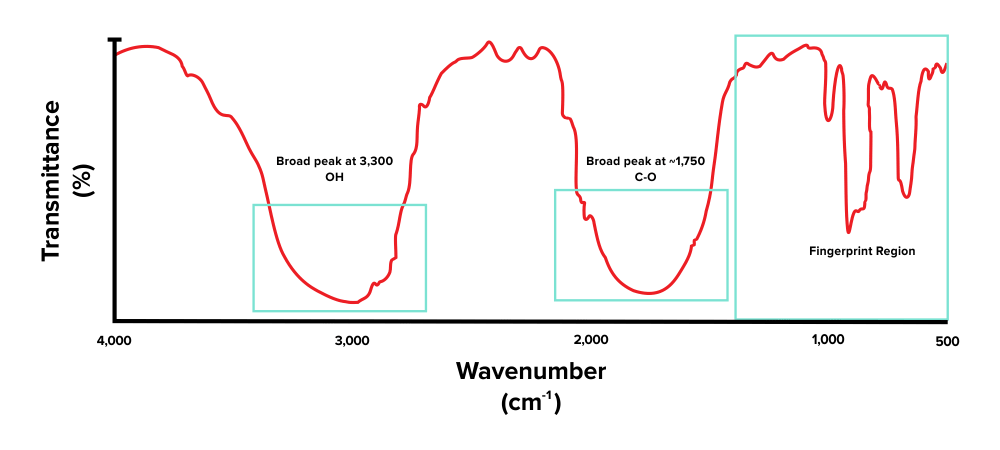
First, note that there is a broad peak at around 3,300 to 3,000 cm-1. This corresponds with the presence of an alcohol functional group (O-H). Next, there is another peak, present around the 1800 to 1600 cm-1 range. This indicates that the compound has a carbonyl group (C=O). The peaks we see towards the very right are within the fingerprint region and are out of scope for the MCAT.
Figure: An IR spectrum of a molecule that contains -OH and C=O functional groups.
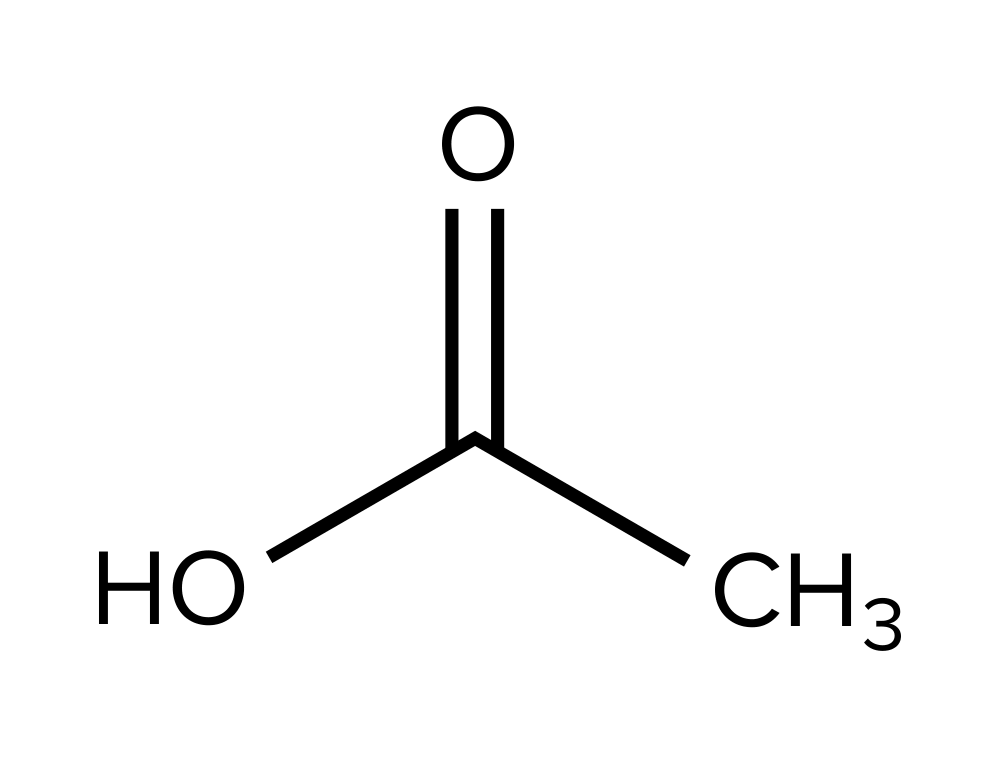
On the MCAT, you may be asked to identify the molecular compound that has generated a corresponding IR spectrum. Let’s try an example, referring to the IR spectrum we’ve been working with.
Which of the following structures is most likely the compound that generated the IR spectrum?
A)
B)
C)
D)
Gain instant access to the most digestible and comprehensive MCAT content resources available. 60+ guides covering every content area. Subscribe today to lock in the current investments, which will be increasing in the future for new subscribers.


